
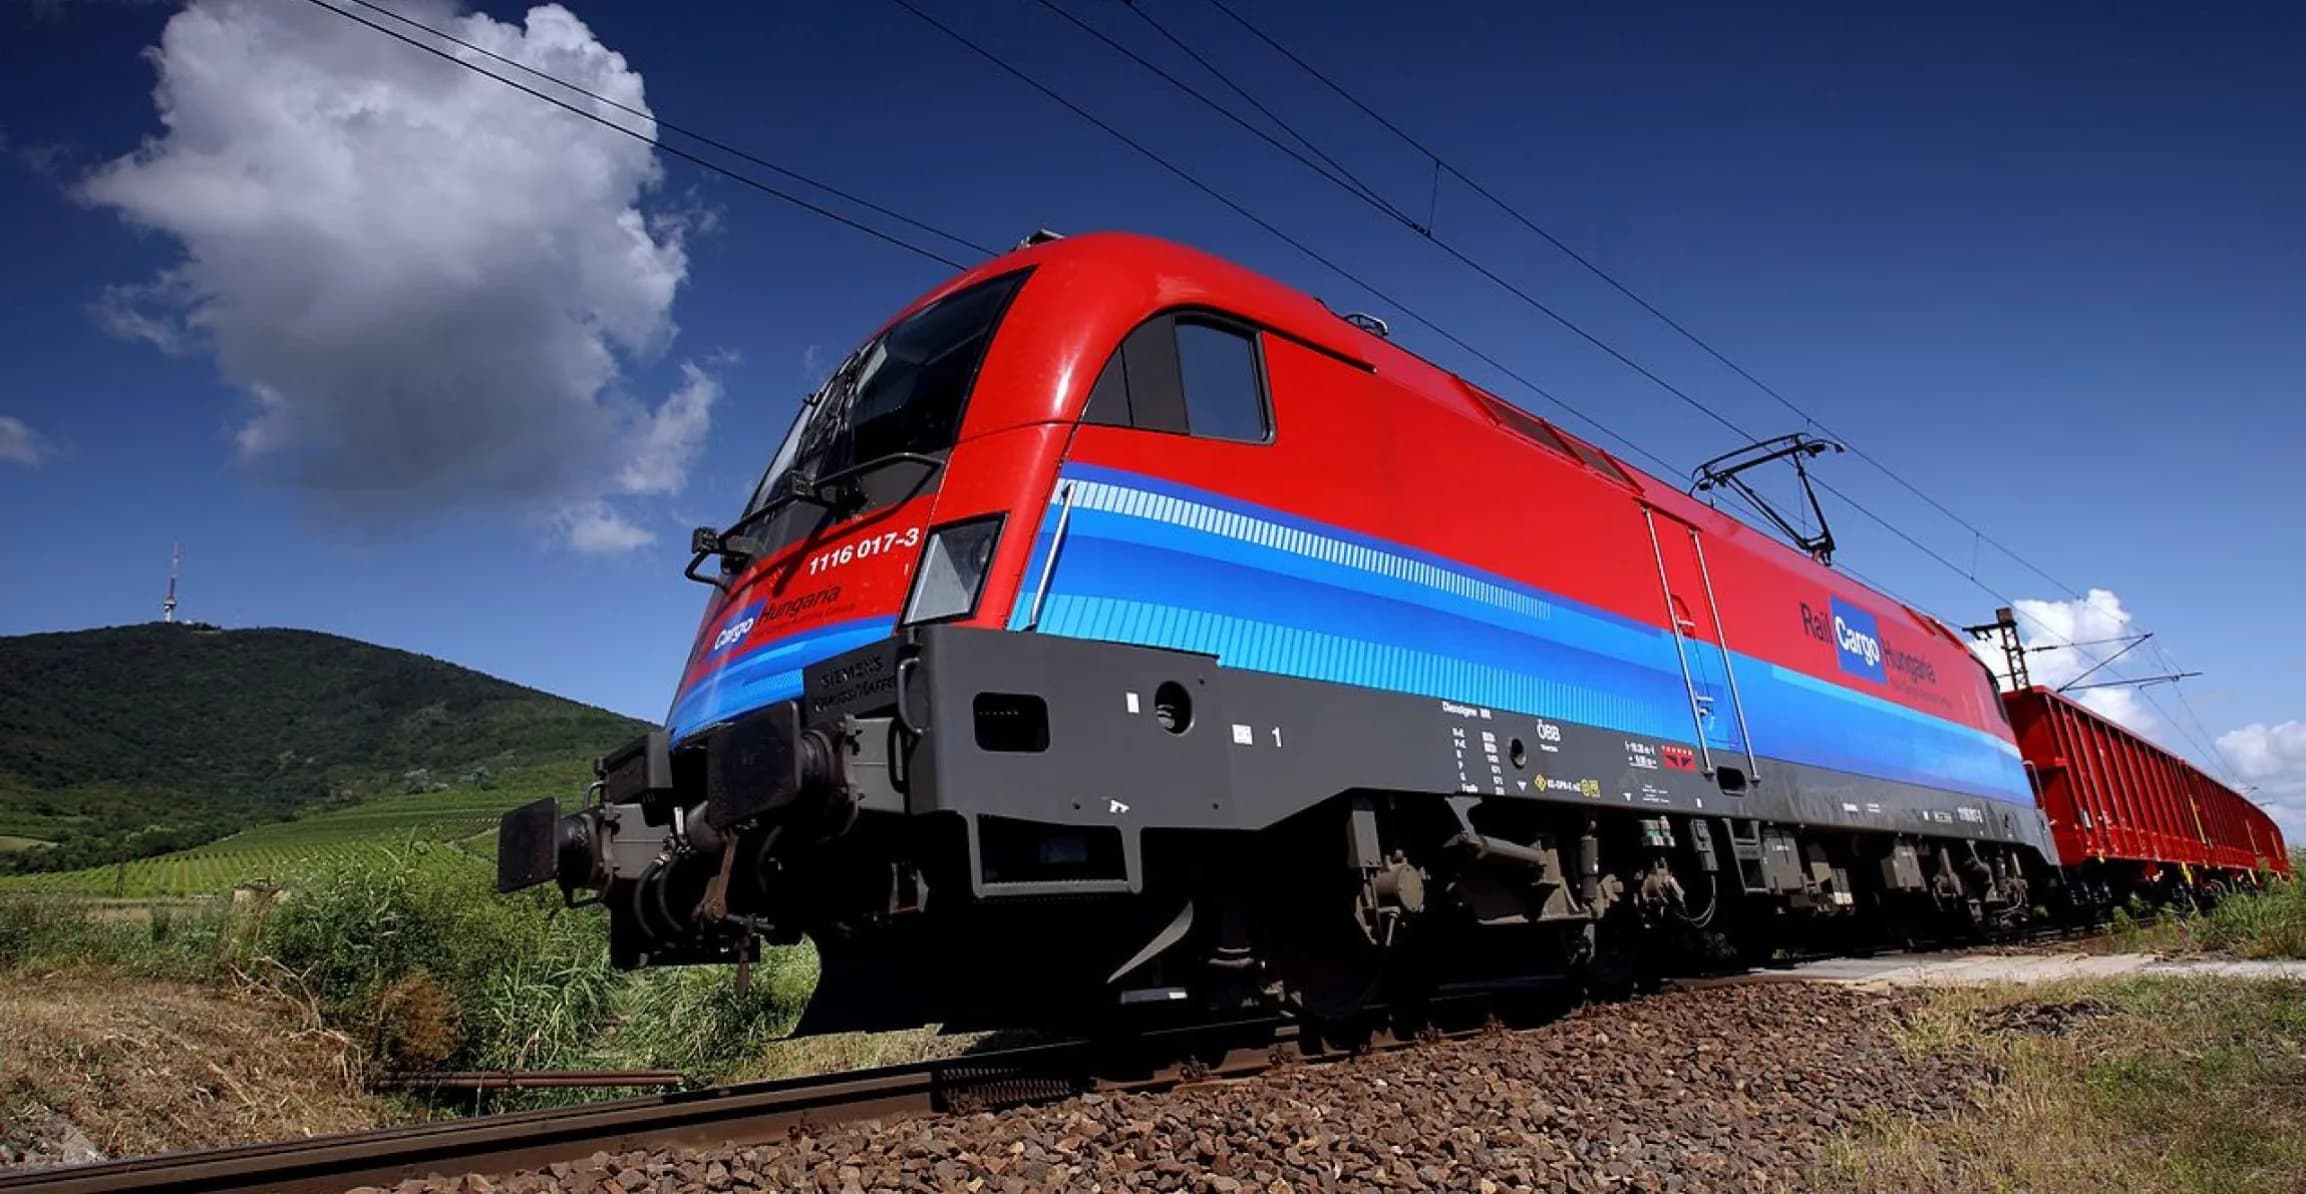
Related case study · Railcargo
BI & Reporting
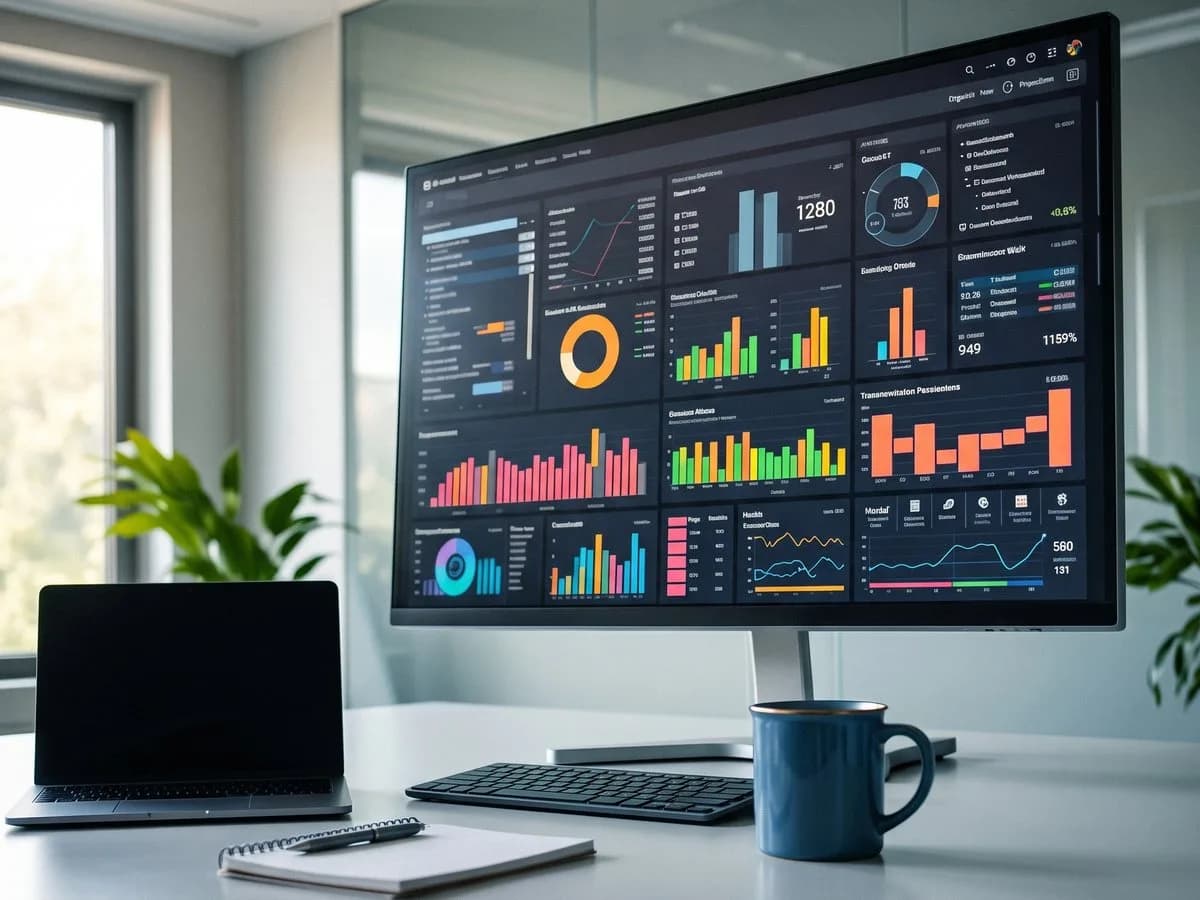
We build reports and management dashboards so that business units can track operations and change based on consistently interpreted data.
01 /
We work with business units to clarify what each metric means and where its data comes from. Consistent definitions reduce the risk of reports that contradict each other.
02 /
We automate the right steps of data collection and report refresh. This leaves more time to interpret the data and plan the actions it calls for.
03 /
We tailor dashboards and visual analyses to the questions users ask. Refresh frequency is set by what the data sources can deliver and what the business needs, so trends and deviations can be spotted in time.
Our approach
We start report design with the decisions to be made. We define which metrics they require and from which data those metrics can be reliably calculated. We shape the interfaces together with users, checking data quality and usability side by side.
How we work together
We get to know the report users and the decisions the reports support. We record the required metrics and their business definitions.
We assess the quality and refreshability of the available data. We design the report structure, the dashboards and the access model.
We build the data connections, calculations and visualisations. Together with business users, we check that the figures are correct and easy to interpret.
We launch the reports and hand over the know-how needed to keep them refreshed. Based on feedback, we refine the views and identify further analysis needs.
Related case study · Railcargo